Double Bottom Pattern Entry and Exit
Updated at: 24 Feb 2024Deepak Painkra
The double bottom pattern is the trend reversal pattern in trading. In this article, we will talk about double-bottom pattern entry and exit in trading.
Table of Contens
Let me walk you through how this chart pattern gets formed.
Double Bottom Pattern Formation
In case the market is in a downtrend, to change its trend, the market needs to create the double-bottom pattern, which I also call a W pattern.
Their chances are rare when the market does recover with a V-shape recovery, and you will find a lot of examples in the live market if you open up the chart pattern of your favourite stocks or index options.
How to Identify Double Button Pattern?
To identify the double bottom pattern, keep an eye on the pullbacks, then draw a trade line on the recent high swing, and when the market breaks the recent high swing, it will be called a double bottom pattern.
Let me give you a couple of examples in the chart pattern so you will get to know.
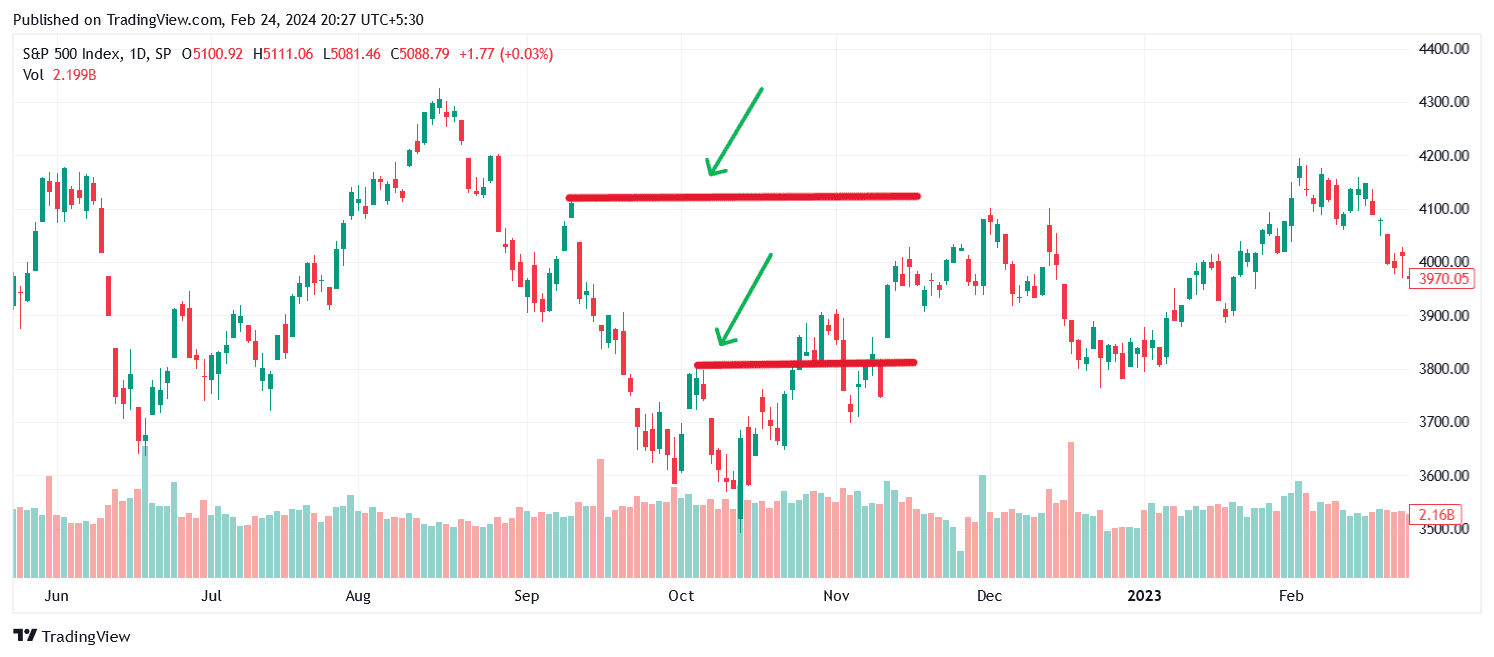
If you see this chart pattern, which I have shown you in the image, I draw a trade line, which means it could create a double bottom pattern.
Entry and Exit Point of Double Bottom Pattern
The entry point must be a recent swing if you want to be a safe trader, and the stop loss will be a recent low because chances are high it could create an N pattern, I would say breakout failure, also where a seller will be active again then the market will head to reverse direction.
Note:- It's better to say W pattern to get proper entry and exit because it will be helpful to identify this chart pattern more readily.
So, the exit point is when it creates a full W-shape, but nobody predicts the exact area. The market could give you follow-through if it waits and gives you a breakout.
Double Bottom Pattern Rules
These rules to follow when trading with this chart pattern, so let's dive into it,
- See the previous trend to check if the pattern is bullish or bearish.
- The stop loss will be the low swing, and if it breaks the low, it will continue.
- Remember, it could be a breakout failure.
- Shap could be different and not exactly a W shape, but it works the same as usual.
Double Bottom Pattern Example
Here are some live examples of the double-bottom pattern, and it will also consider you must remember the concept which we have discussed in this article,
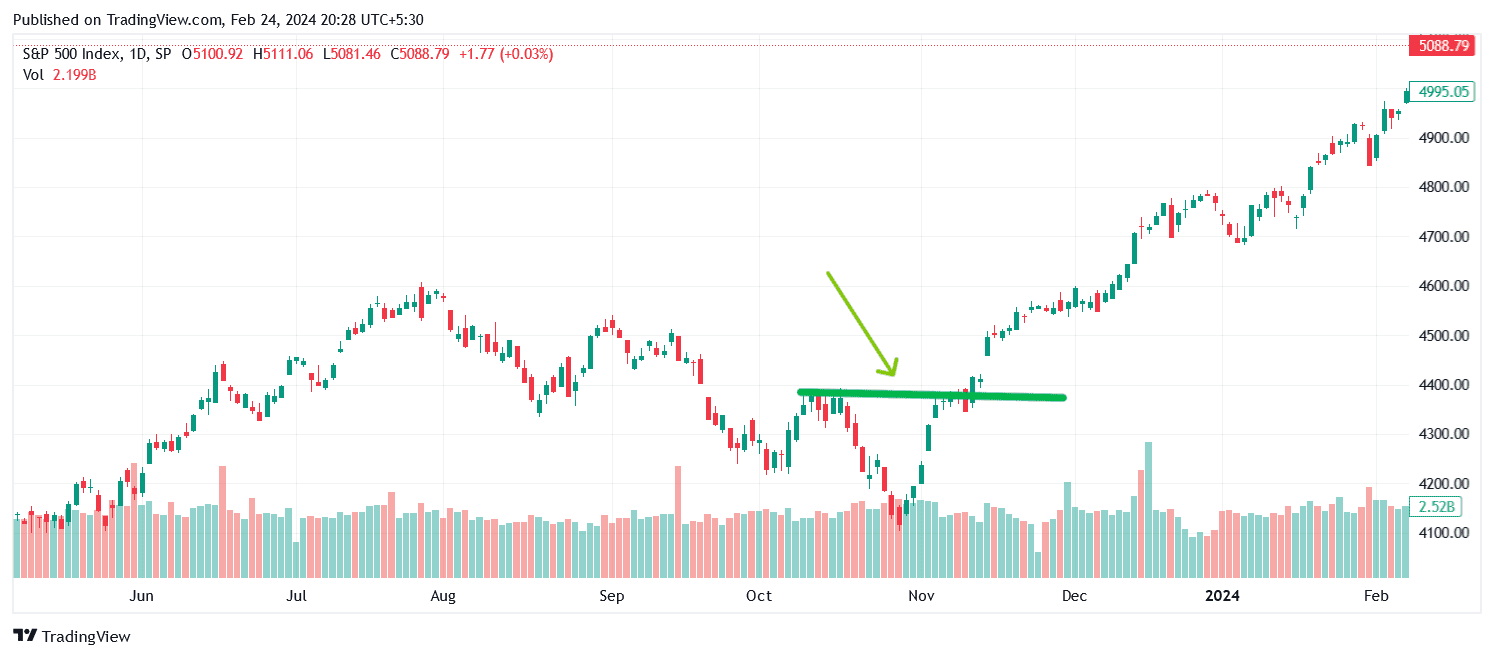
A shape could be different, but the concept will be the same as usual, which you can see in the image.