How to identify Pullback and Reversal
Updated at: 27 Jan 2024Deepak PainkraIn this article, I will discuss a way to identify pullback or reverse trends in the stock market, so let's dive into the method to identify reversal trends and pullbacks.
Table of Content
What is Pullback?
A pullback is a retracement of price action, which is good for market stability. The market can't go straight forward in one direction, and it needs to give pullbacks so that fresh buyers will add their position and the market head in the right direction.
Let me walk you through how anyone can identify pullback and trend reversal in trading,
Difference Between Pullback and Trend Reversal
If the market follows the trends and does not recover more than 50% of the trends of the breakout, then it can give you a breakout, and if it recovers more than 50% of the trends, then there are some chances that the market will be giving you trend reversal.
Note:-The same thing will be relevant for both up and down directions.
Method to identify Pullbacks and Trend Reversal
Understand the Trader's Mindset
First, let us understand how the trader mindset works. The selling market is always fast, and you must wait for the market to create any technical pattern, such as Double-top for the Top and Double Bottom on the Bottom.
If you wish to learn more about technical patterns, explore more articles on this website.
Technical Pattern to Identify Pullback or Trend Reversal
These are the technical patterns to identify any pullbacks and trend reversals in the market,
Pole and Flag Pattern
When the chart pattern gives the market breakout, and after the bull run, if the chart pattern retraces then follows the trend, it is called a pole and flag chart pattern.
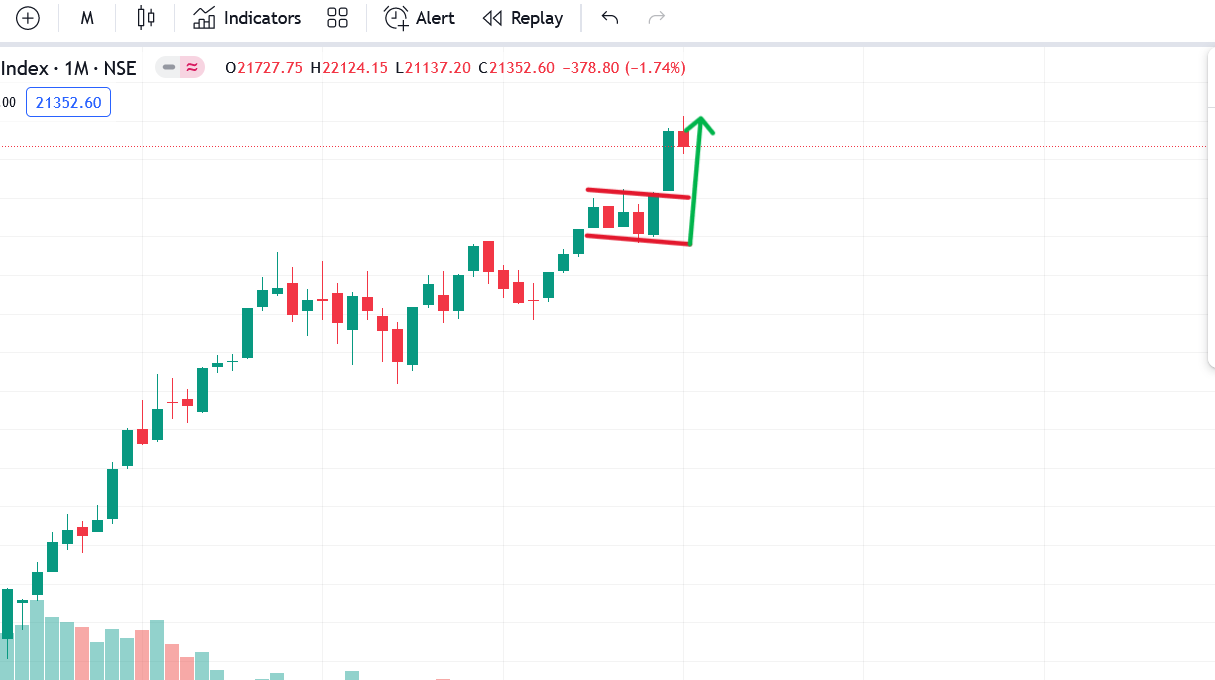
The Pole and flag pattern is considered a bullish pattern in the stock market and trading in general, and the image I have shown above is a live example of a pullback and then break out in a monthly time frame.
Planning for Trend Reversal
These things to Notice when identifying Trend Reversal
- When trends get a reversal, it always creates an M pattern at the top and a W pattern at the downside.
- 50% recovery of the trends means an opportunity for reversal or deep correction.
- See the market trend. And if the previous trend is bullish, it will be bullish, and if it's bearish, it will be bearish.
Here is another chart pattern to identify pullback and trend reversal,
Mother and Baby Candle
After continuously buying or selling, if the market opens in the opposite direction the next day, then it will create a mother and baby candle, which means the buyer and seller get trapped in the market. This type of market usually goes sideways. Also, it creates a mother-and-baby candle.
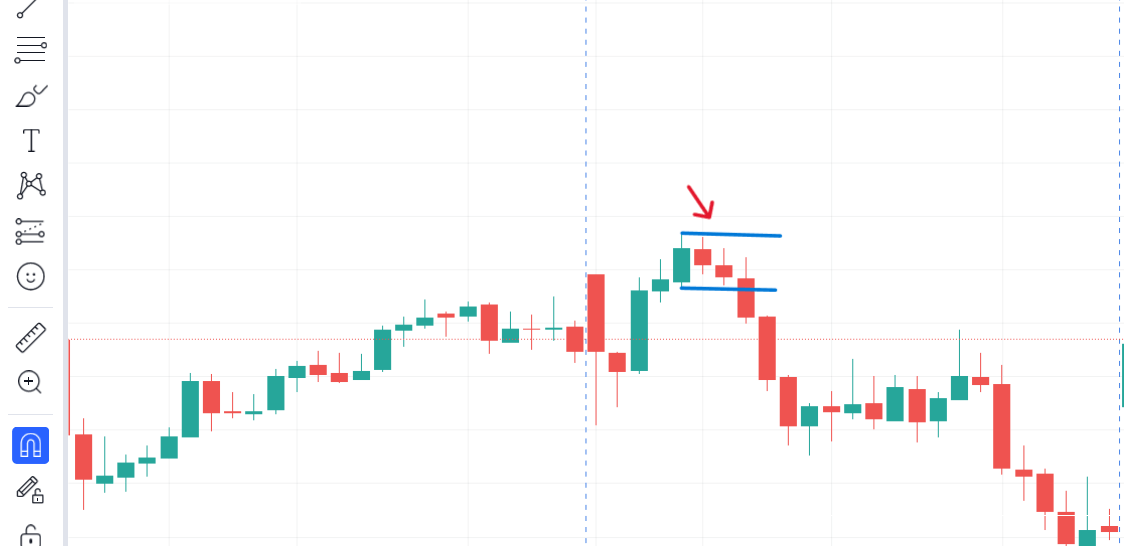
I have written separately in depth of this technical chart pattern, so check them out.
After using this chart pattern, you won't miss any trade, but the stop loss will be a little bit big. I have written a blog article on how to trade this chart pattern, and I recommend you check it out.