Pole and Flag Pattern - Option Trading
Updated at: 01 Jan 2025Deepak PainkraIn this article, we will discuss the Pole and Flag Chart Pattern, also called Flag and Pole, and I will walk you through how you can identify this pattern in the market.
Table of Contents
What is the Pole and Flag Chart Pattern?
After a continuous bull run, if the market goes sideways or creates a chart pattern like a Pole and Flag, then it will called a pole and flag pattern.

Note:-Always aware there is a difference between sideways vs trend changes.
There are serval rules to follow to trade with pole and flag chart patterns,
Identifying the chart Pattern
There is one chart pattern, which is called the bear flag pattern, which is a kind of similar to the pole and flag chart, but you must focus on how to use this pattern instead of shape or anything.
How to Identify Flag & Pole Chart Patterns?
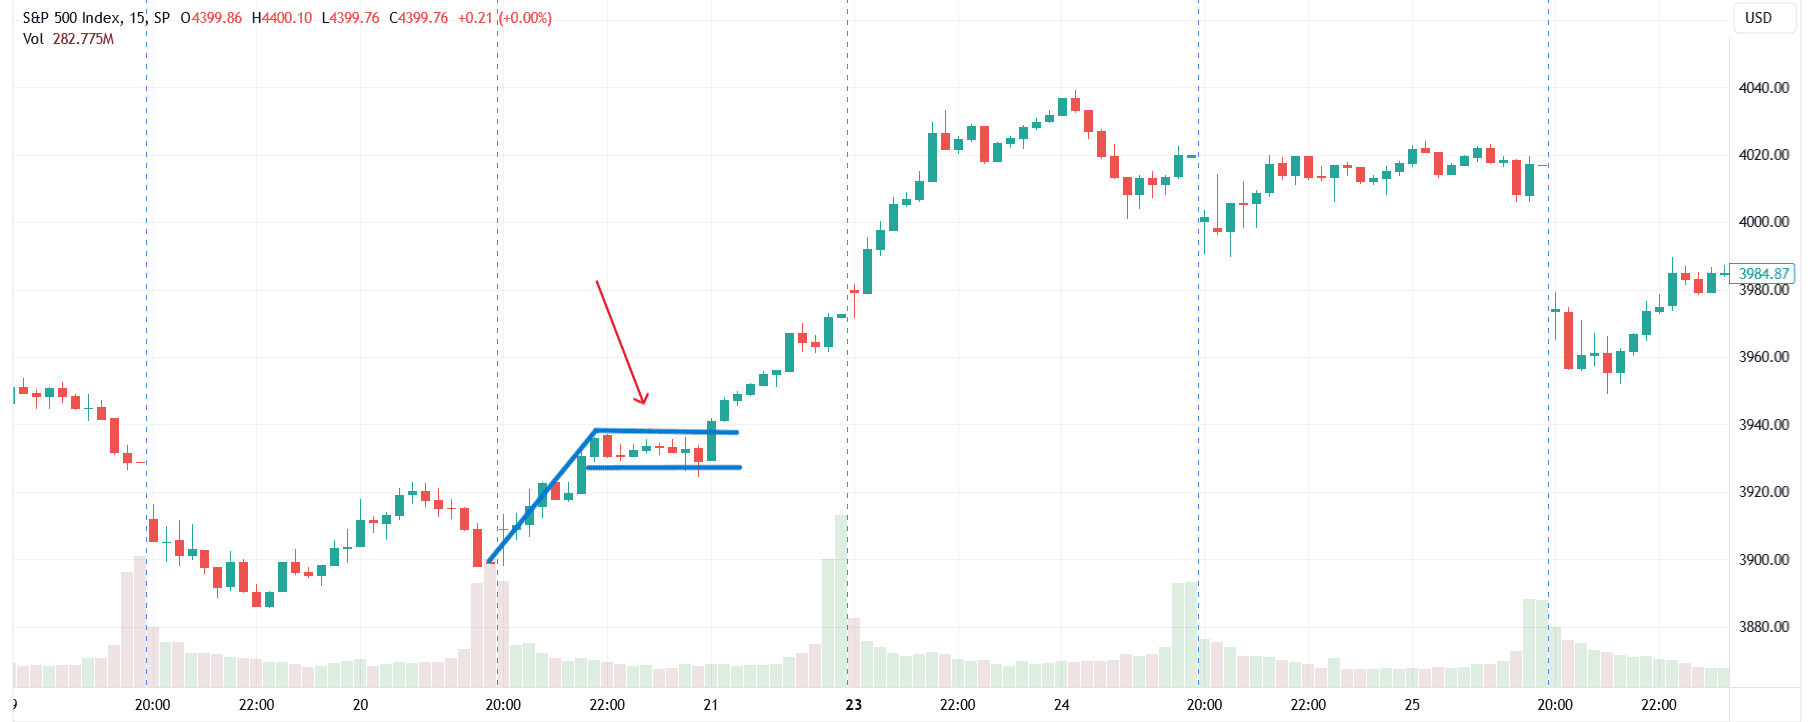
If the market gives you an instant up move, after that, if the market goes sideways or spends some time, then it can give you an up move. Also, let me walk through a live example of a Pole and Flag Pattern in the chart.
There are two types of Pole and Flag Chart Patterns,
- Bullish
- Bearish
Bullish and Bearish Pole and Flag
These are the two types of Pole and Flag patterns, and let me walk you through the easiest way to identify them in the live market so that you can capture this pattern in the market and easily distinguish between a bear and bullish pattern.
1. Bullish Pole & Flag
Bull shows bullishness in the market, and the bear shows how bearish the market is. Look at the previous trend. If the trend is bullish, it will be bullish.
When this chart pattern breaks the level, it gives you good momentum, depending on whether it's bullish or bearish2. Bearish Pole & Flag
Look at the previous trend. If it is Bearish, then it will be Bearish. If the data shows bullish, it depends upon which time frame you trade, and if the trend is bearish, then it will be bearish.
Accuracy of Pole and Flag Chart Pattern
As I always say, you must focus on maintaining risk to reward ratio rather than accuracy and all this kind of stuff.
Pole and Flag pattern has more than 50-60% accuracy, and accuracy may differ depending on the situation. There are two scenarios. Either it can go up or down. Always be sure to put a proper stop loss.